Graphical representation of data always gives high readability and easy understanding to anyone. Therefore users may require some reports by graphs and charts. Crystal Reports have a powerful graphing and charting engine and it provides 36 different types of charting templates.
Crystal Report provides four main general categories (layouts) of graphs.
1. Advanced
2. Group
3. Cross-Tab graphs
4. OLAP
This article focuses on creating chart report using ‘Advanced layout’. Future articles will focus the other layouts.
Technologies:
Crystal Report and ASP.NET
Language:
C#.NET
Prerequisite:
SQL Server 2005, Visual studio 2005/2008, Crystal Report.
Here, we are going to produce a report which will represent election results graphically. First, you have to design a database. The created database name is ‘ElectionResults’ with one table called ‘Vote_Results’.
There are three columns in Vote_Results table.
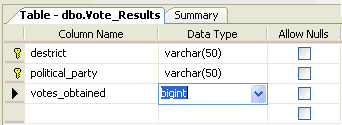
Note: The database design is for demonstration purposes only.
Let us design a report using advanced layout in crystal report, get number of election results for political parties’ district wise.
To design the report, there are two standard ways. The first way is we can use the crystal report and second one is we can use the Visual studio. Here we are going to use Visual Studio.
First open Visual studio 2008 or 2005 and create new web project called “ChartswithASP”. Then right click the project in ‘Solution Explorer’ and select ‘Add New Item’ and select ‘Reporting’ from the categories. Then select ‘Crystal Report’ from the templates list window.
When you select Crystal Report, give a meaningful name to the report. Here, I have given “ChartSample1.rpt”. Then click Add button.
Once you click the Add button, you will get a window as shown by the following figure.
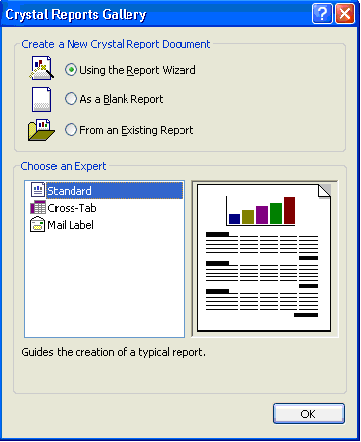
Select ‘Using the Report Wizard’ option and keep the ‘Standard’ report format and click OK button. Then you need to create the database connection to access tables within the database.
Once you click the OK button, system will give a window to select the connection type as shown below.
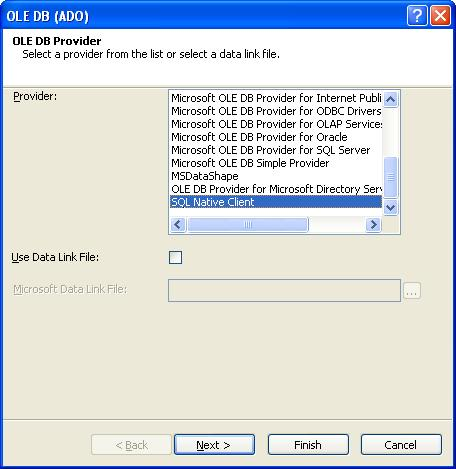
This demonstration report is to work with SQL Server 2005 database. So you need to select SQL native client as provider (As above figure shows).
Then click Next button, to continue report creation process. System will provide a screen as below.
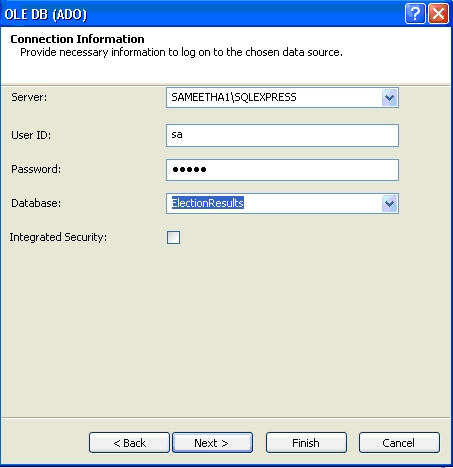
After that, you need to assign details of SQL Server and user credential to access the database from the report. Then you need to expand current connection tag, select your database connection then select the relevant table as shown by the following figure.
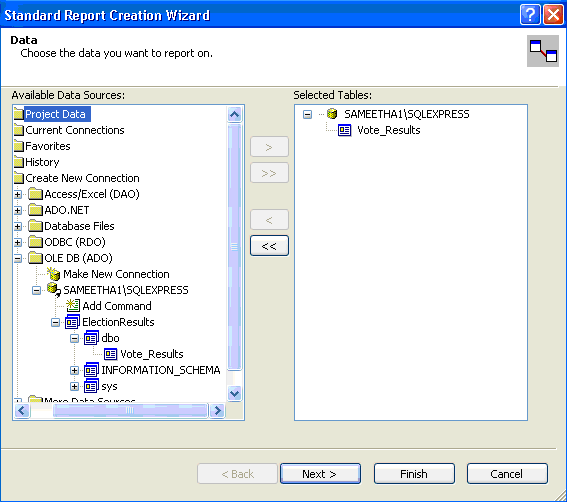
Now, you can select the tables which you need to retrieve data to the report. Here we have only one table; therefore we have selected that table. Then click Next button to continue.
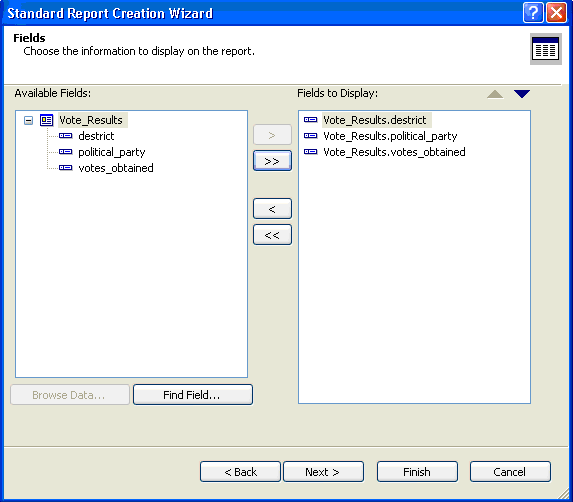
There you need to select fields from selected tables to design report as shown by the following figure.
Here we have selected all three fields from the table.
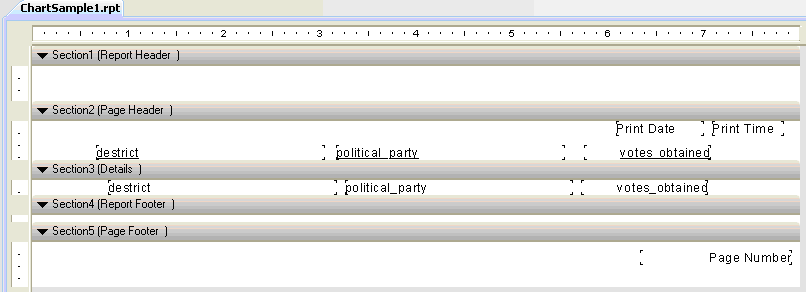
Click ‘Finish’ Button. Your result report will be shown by below figure.
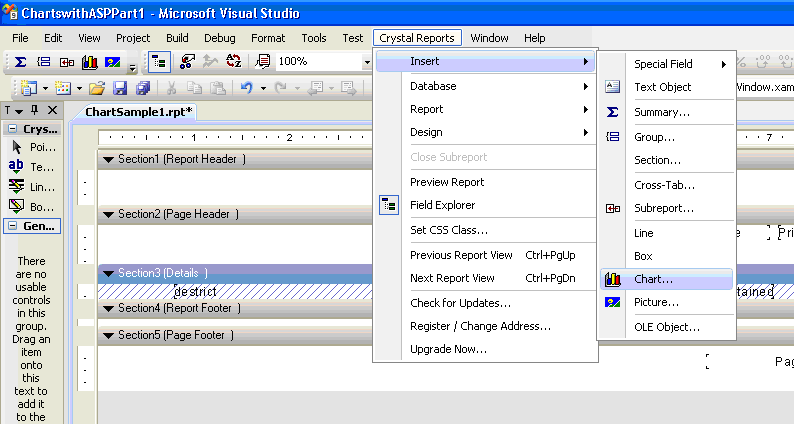
Now, our focus is to represent these data graphically; therefore you need to hide the ‘Details section’, by right click the ‘Details section’ and select ‘Surppress’.
Then from the menu select Crystal Report => Insert=> Chart. (As shown by the following figure)
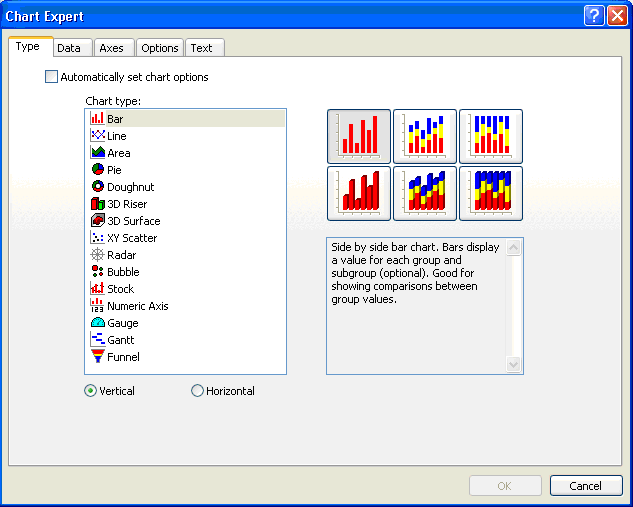
Once you click that, system will give a screen like follow with many chart types. You can select any type of chart from this list. If you unchecked ‘Automatically set chart options’ then you can see another two tabs will appear.
Now, we have selected ‘Bar’ chart, vertical option and Select ‘Side by side bar chart with 3D visual effect’ from right hand side.
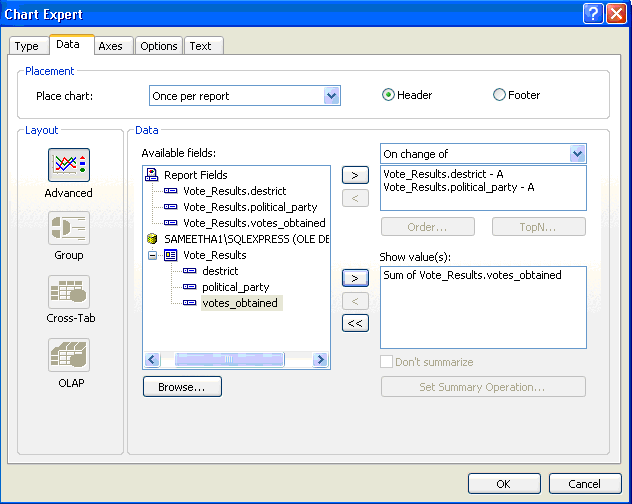
Then go to the Data tab. Select ‘On change of’ , ‘select destrict’ field and ‘political_party’ fields from available fields. Then select ‘votes_obtained’ field as Show Value(s), shown by the following figure. Here you can see ‘Advanced’ is the selected layout in the left hand side.
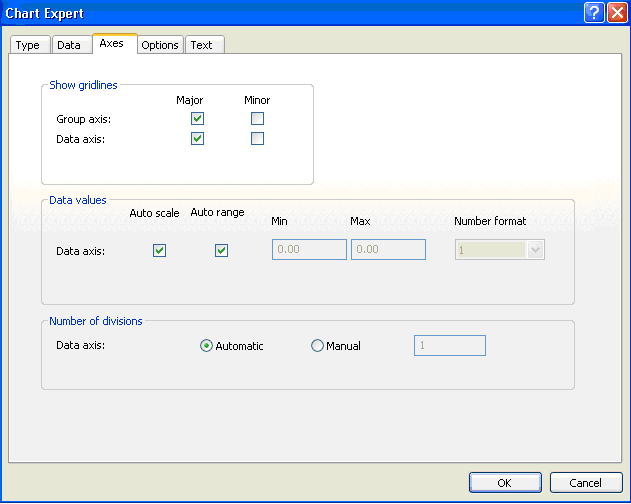
Now go to the Axes tab and set the values as shown by following figure.
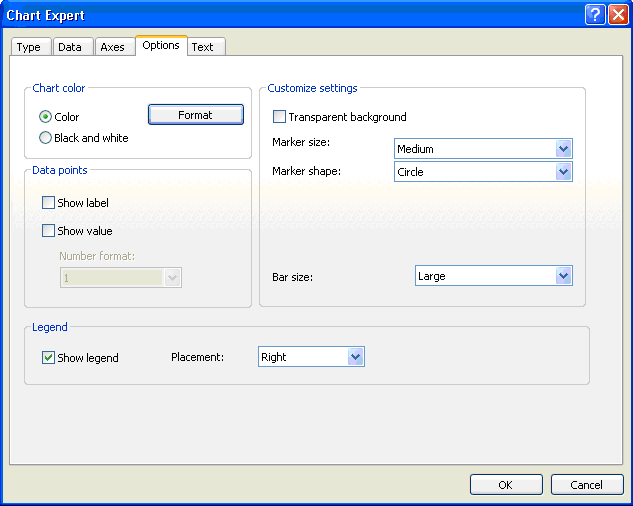
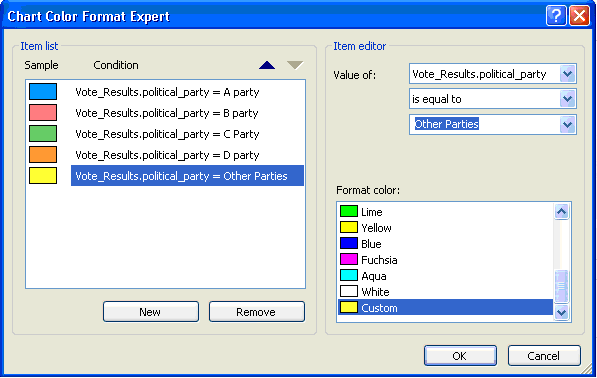
Then go to ‘Options’ tab. You can see a ‘color’ option button. Once you select that and click ‘Format’ button you will see a screen as shown by following figure. Here you can select different color for different party.
Note: This is an optional setting. If you are not setting colors here, system will automatically assign some colors.
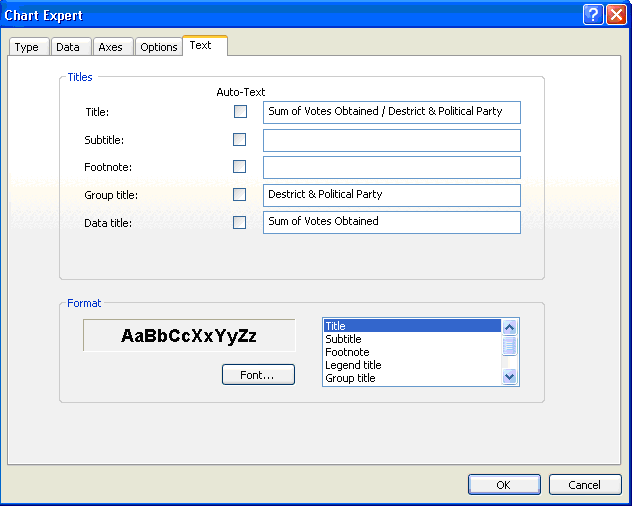
Then go to ‘Text’ tab. You can see here Titles for the report, by default. If you need you can change like follow.
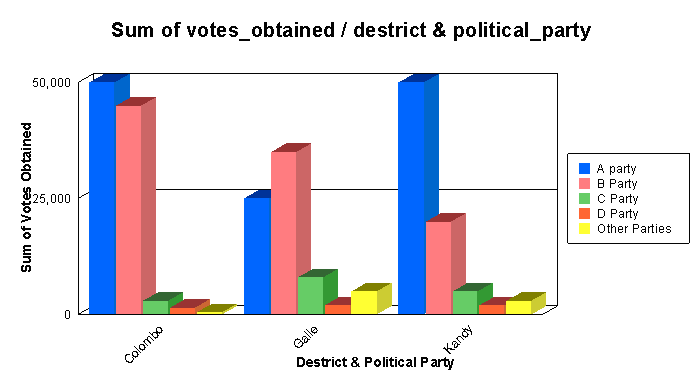
Now, Click ‘OK’ button. You have followed all the essential steps and the result will be a bar chart. But this is not the final report with actual data.
Now you need to add Crystal Report viewer on the ASP.NET Webpage.
Let us see, how we can add the report viewer on the page, just look at these HTML tags.
Create a table in the form object. Then add HTML row and a column.
Then place the CrystalReportViewer to the column as shown in the above HTLM tag.
If we compile this application, it will give a compiler error “CR doesn’t exist”. Therefore, you need to register Crystal Report namespace on the top of the page as shown below.
Note: when you double click on toolbox in the CrystalReportViewer, Visual studio will do all registeration and etc.
Now write few lines to display report on the viewer.
Then build the web application and run, you will get a report with chart.
Conclusion:
This article is focused on creating chart reports using advanced layout option. We hope this article helped you.
Author's Information:
Name : Sameetha Jeyaganesh.
Degree : Bsc. degree in Computing
B.Sc. degree in Computing.
- 6+ years experience in C#.net, ASP.net and VB6, SQL server, Crystal Reports
- Designing Desktop and web applications
- Obsessed in OOP style design and programming.
- Designing and developing a client/server application for sharing files among users in a
way other than FTP protocol.
The summary of my skills:
C#, VB.Net#,ASP.net, Java, WPF, SilverLight, My SQL, SQL Server, MS Access